MyEROAD Map Redesign
About the project
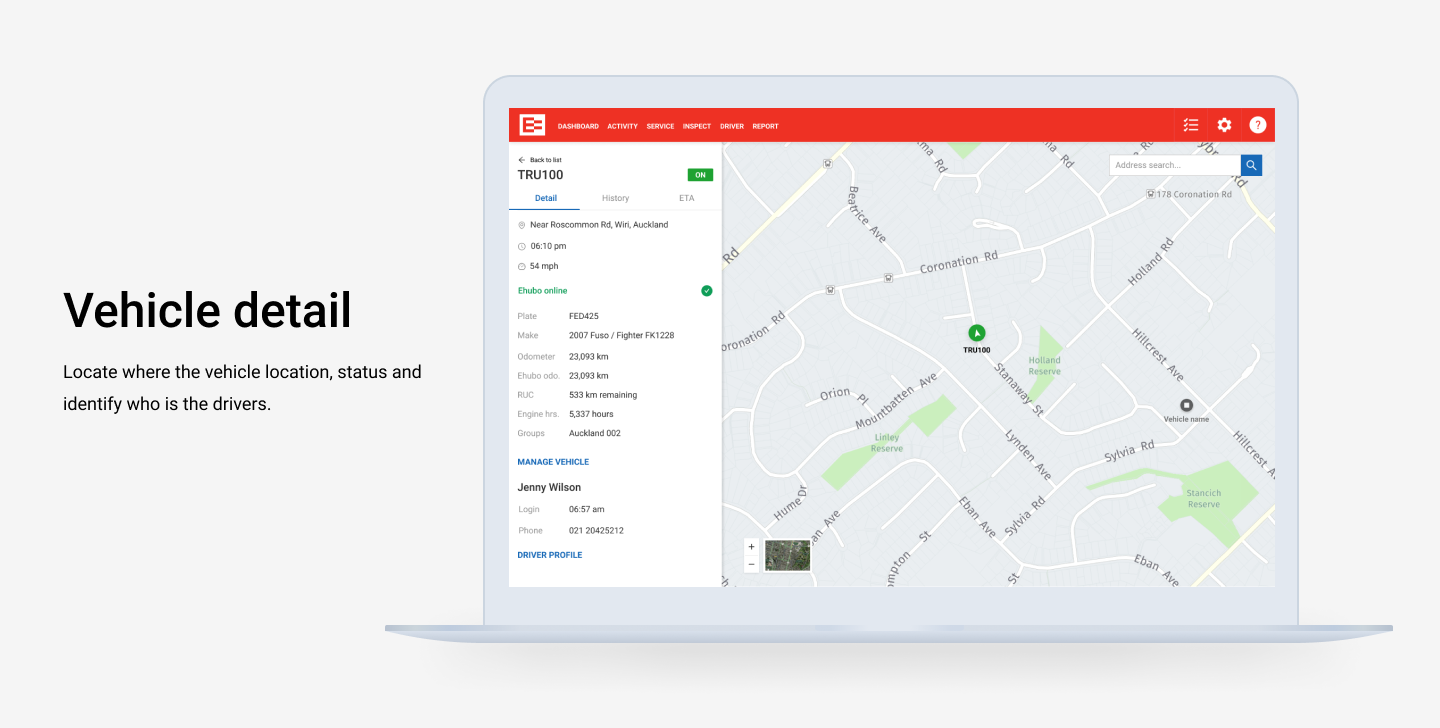
EROAD's main business is to provide GPS tracking for improved visibility across your fleet. This gives you high-resolution, instant, and accurate vehicle tracking. EROAD's fleet management system helps back-office staff understand the holistic state of their business, the current location of their assets, and enables auditing of vehicle and employee activities, such as timesheet hours, job site visits, and break times to ensure driver compliance. This functionality allows for optimizing routes, managing jobs, and dispatching vehicles, leading to productivity improvements that keep customers satisfied, drivers safe, and the business profitable.
Why the redesign?
Initially, EROAD focused on serving small to medium-sized fleets, but as their business scaled, so did their products. Previously, the map page only allowed fleet managers to view 100 vehicles at a time, which prevented users from having a single holistic view of their fleet. Our main goal is to enable fleet managers to support up to 10,000 vehicles on the map while streamlining the workflow and providing quick win features.
My role is to lead the redesign of their fleet management features by integrating similar yet distinct map functionalities through their web portal. This helps fleet managers and dispatchers complete their daily tasks within a single interface. Ideally, we aim to reduce the time users spend switching between different pages, minimize administrative work, and prioritize keeping their drivers safe on the road.
Observe and identify
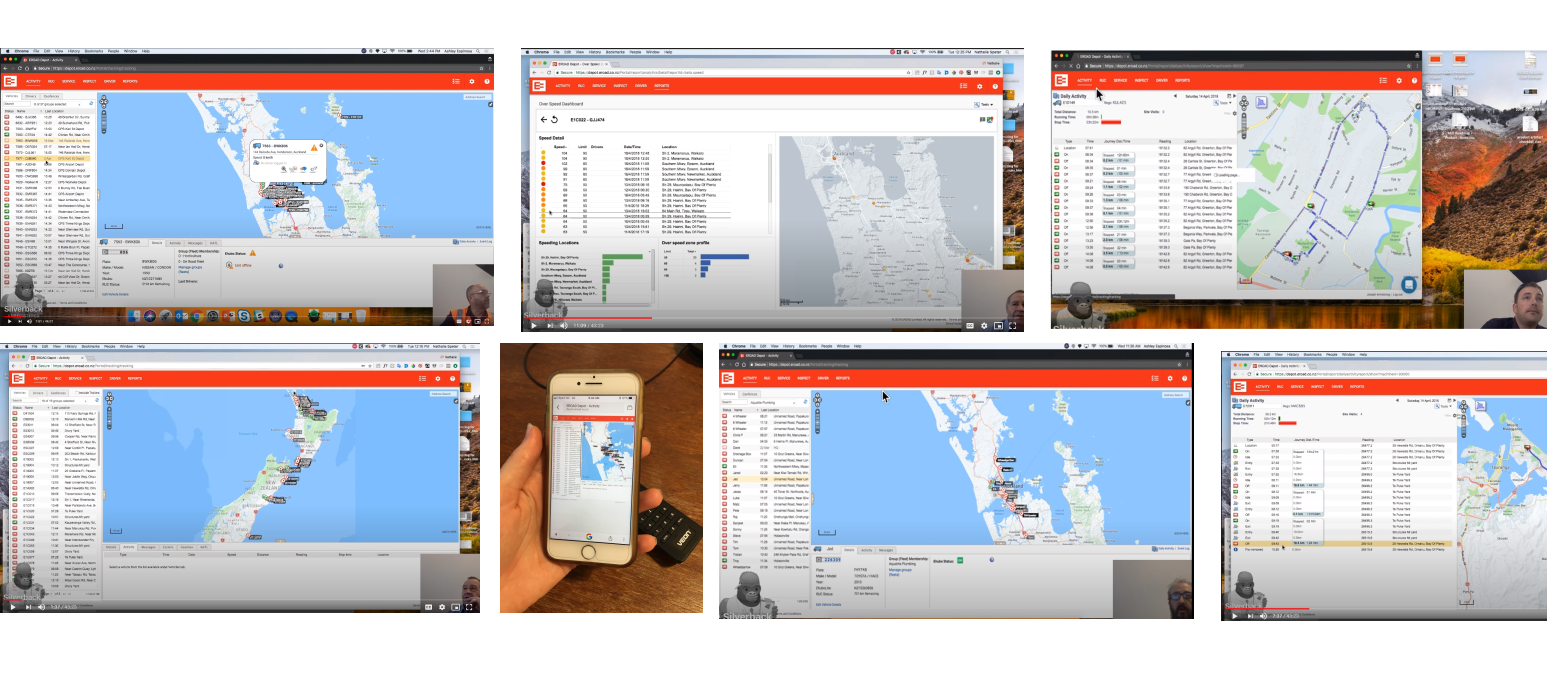
To kick-start the project, I conducted discovery interviews with customers to understand their daily, weekly, and monthly tasks, pain points, and benefits. This process helped us gain insight into how they used the product based on their roles, company size, and industries, allowing us to empathize with our users. I checked with account managers, customer support, and the development team for bugs or feature requests related to the map. Using our analytics tool, Pendo, and Salesforce, I identified the types of users based on roles, industries, and company size who utilize the map. Additionally, I used Google Analytics to examine mobile usage and the types of devices used. Approximately 23% of our users accessed the map on their mobile devices on a monthly basis.
Key Learnings:
Customers were using their mobile phones to buy RUC (road user charges).
The ability to handle ad-hoc and emergency calls while out of the office was essential.
To improve the current offering, I sought out users to interview about their understanding of the product and assigned them tasks to identify flaws in the current design. I also conducted an audit of the old map workflow to evaluate its effectiveness and consistency. This data will help us set goals and analytical points to revisit after relaunching the product to gauge its success.
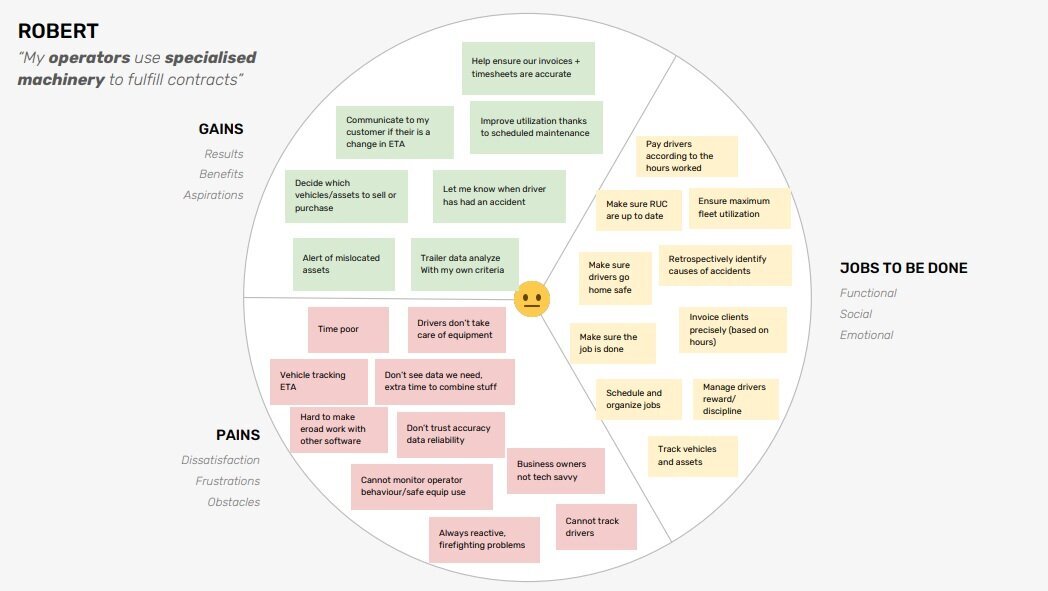
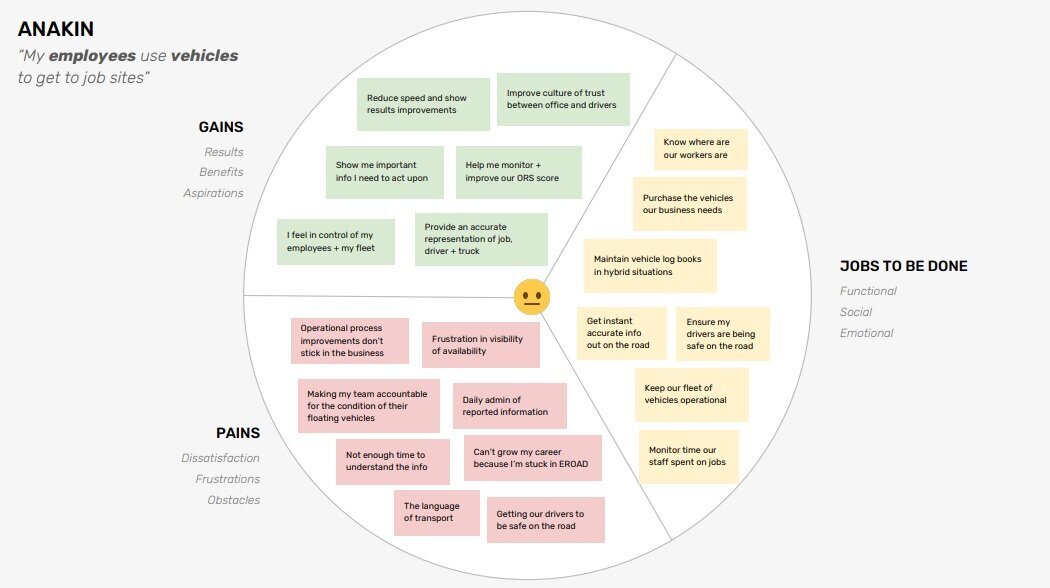
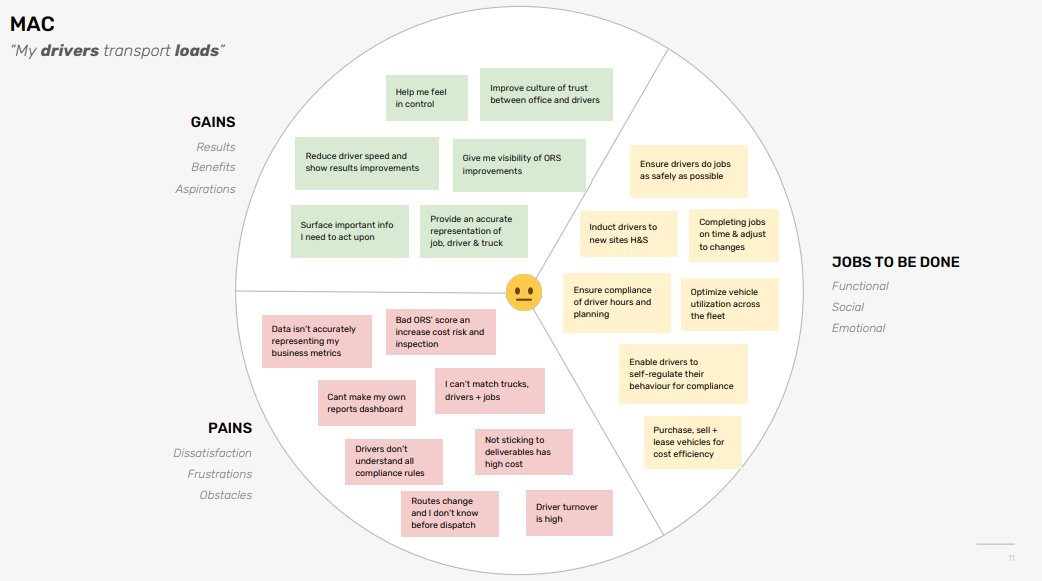
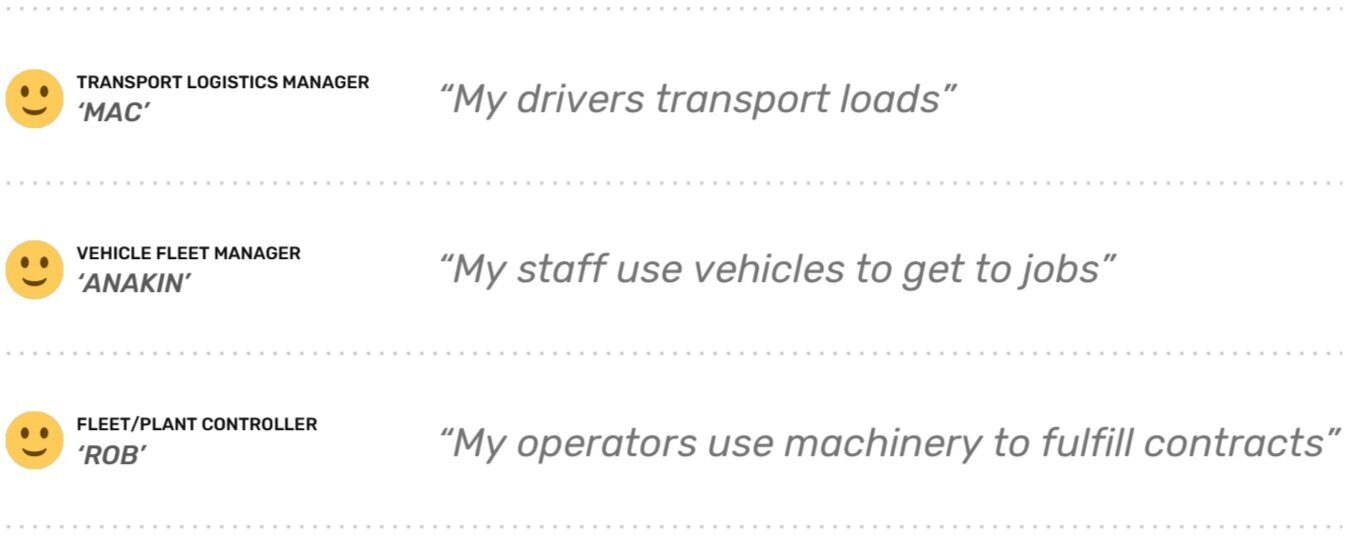
User personas
We used the customer value proposition canvas to capture the pain points, gains, and Jobs-to-be-Done (JTBD) in order to understand the type of users and industries that used the map for fleet management.
The approach
EROAD fleet management software has numerous map features that would take a couple of years to build by our team due to technical debts and a multitude of features. To release and test something in the market, we decided to prioritize feature releases based on the level of user permissions and needs. After analyzing the old map and talking to customers, we concluded that some companies use the "super basic user" permission to display their fleet on a large screen and share it with their contractors' fleets.
"Super basic user" only show a live view location of the vehicle.
we targeted the “super basic role” which was 5% of the map users based where users can only have access to vehicle live location only.
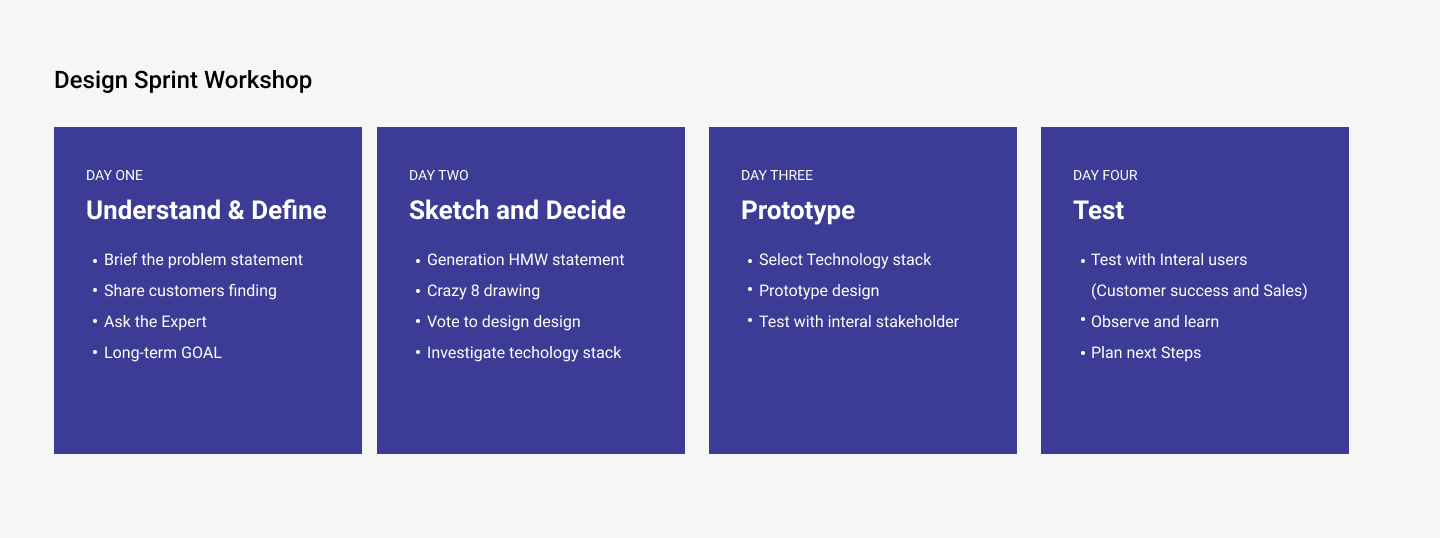
Onboarding the team
To quickly kick off this project, I conducted workshops with the development team to communicate the problems we were facing. We organized a 4-day design sprint workshop with the team to test new technologies and frameworks.
Our goal was to determine if the new map technology could support displaying up to 10,000 vehicles, test map clustering, and assess UI restrictions.

Wireframe
My assumption is that the map could potentially attract more mobile users. Therefore, I took a mobile-first approach with the redesign. Creating holistic view sketches and user flows as part of our strategy helped us make sense of future upcoming work and provided the team with a clear vision of the product.
Wireframe was used to communite with the team to start early development.
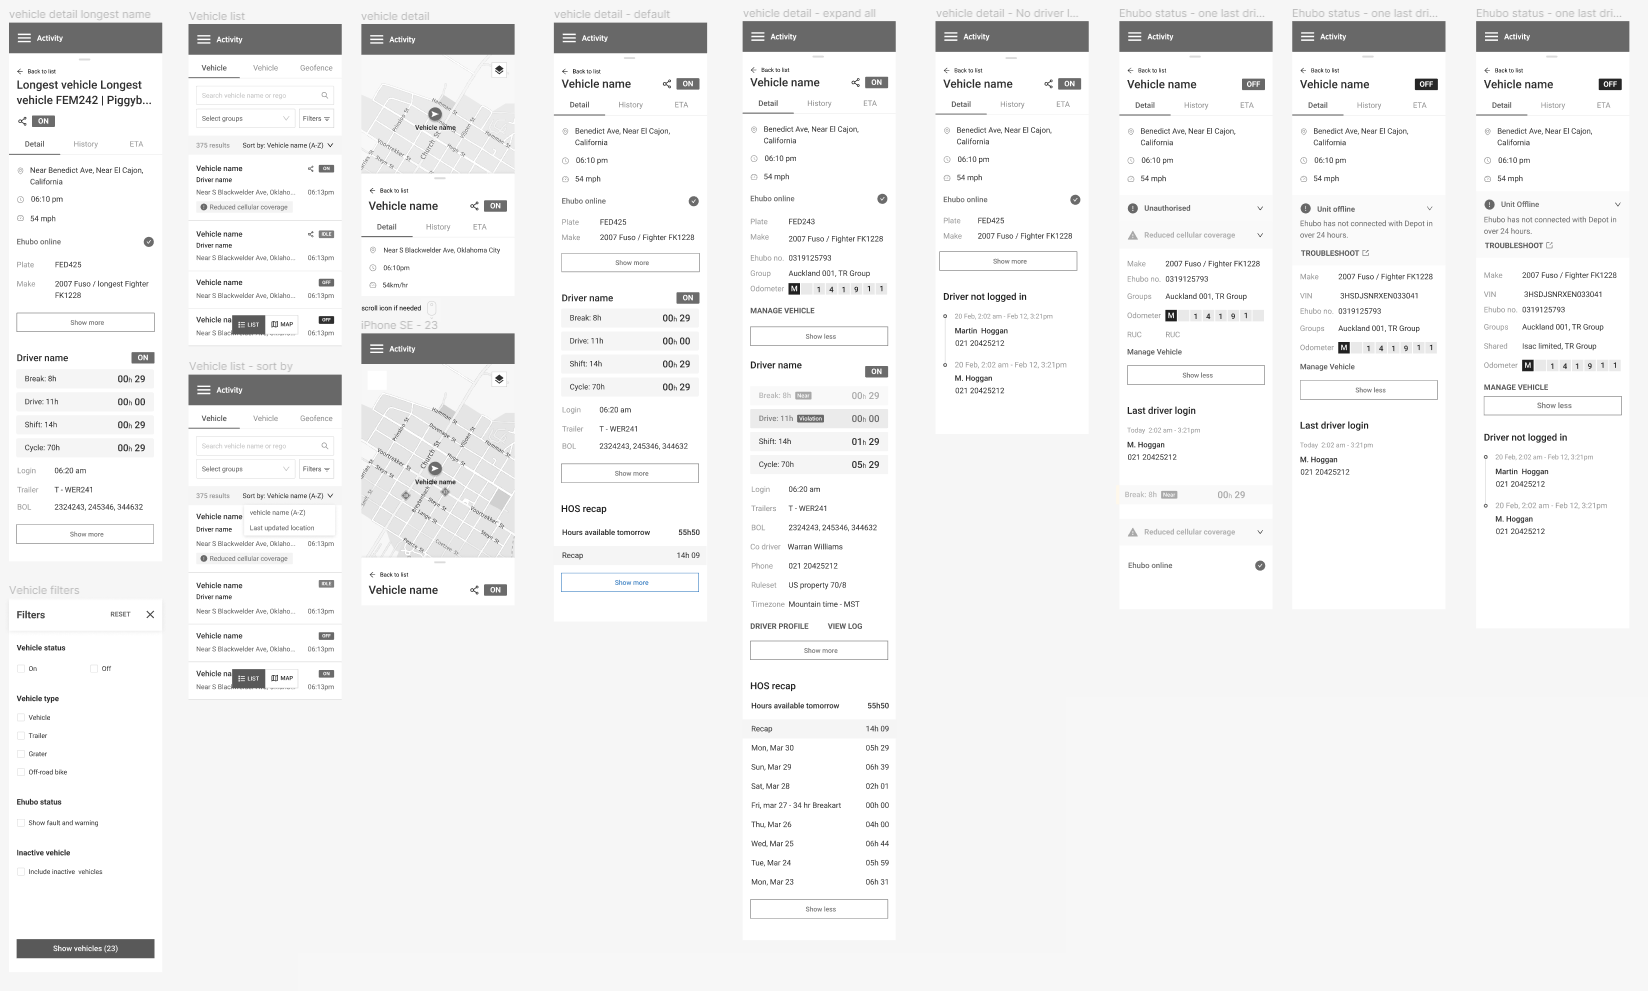
User testing
Test with 6 users and see if they can complete a set of tasks and record findings. Small Iterations on the wireframe were made based on user testing results.

User interface
Design the final UI and prep for development.


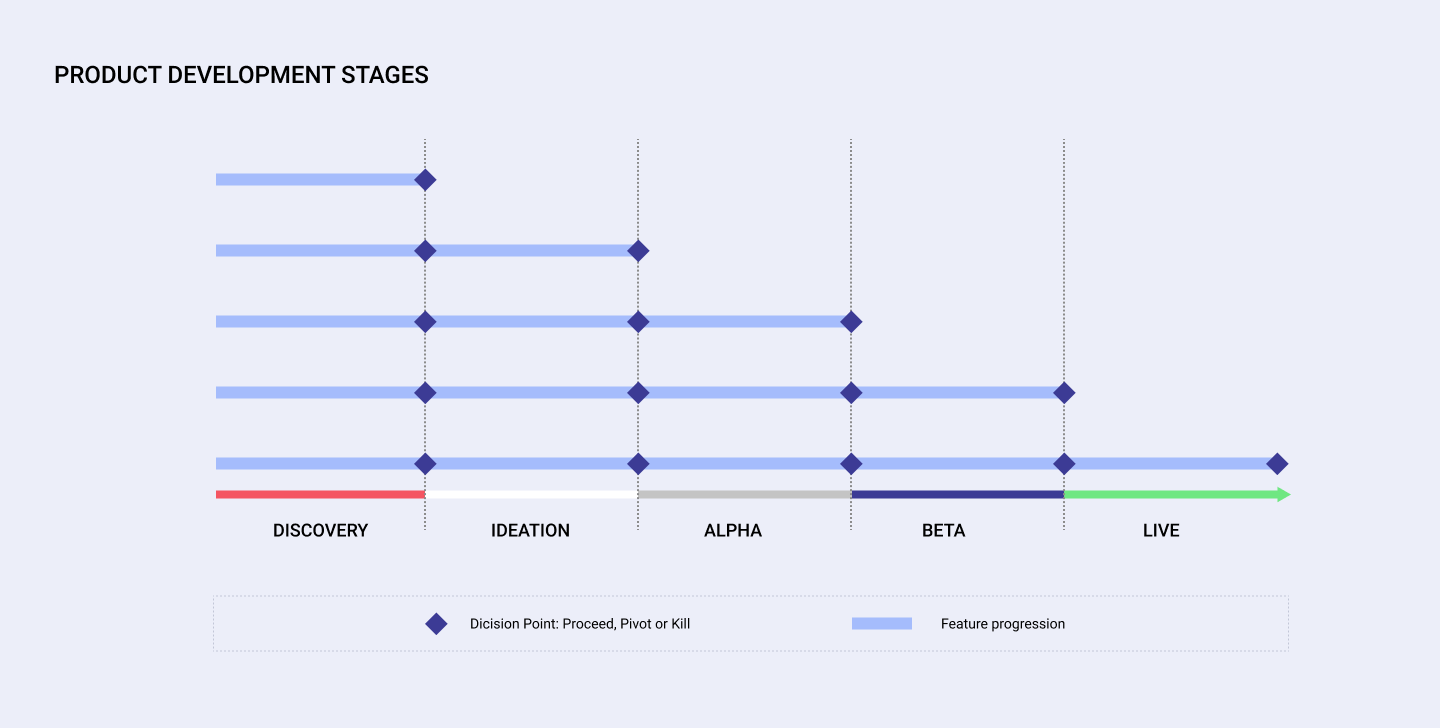
Release phrase
As a team, we agreed to allocate 15% of our time in the future roadmap to enhance existing features and add missing elements for our selected user roles and permissions. This approach allows us to ship more features to support higher permission users.
Alpha phrase
The initial release was limited to a small number of customers, and these numbers increased as we built more features to support users with higher role permissions. Throughout the alpha phase, we conducted an ESAT survey with all alpha users to measure their level of satisfaction and identify any missing elements
Beta phrase
We released the minimum lovable product (MLP) to all customers, providing them with the ability to switch between the new and old maps.
Measuring success
Our goal is to create a scalable product that supports both small and enterprise customers. We will monitor the product usage through Pendo, the Custom dashboard, Google Analytics, surveys, and the customer success team.
More than 50% of customers will toggle and use the new map over the old one within the course of 3 months.
NPS for the map should be higher than the current one after 3 months of release.
An ESAT survey was sent out to help us determine what to build next.
A custom dashboard was set up to track how many users converted to the new map, which is displayed daily during our standup meetings.
Summary
Redesigning the SaaS application posed a unique challenge, especially since the current technology EROAD was using couldn't scale with their customers. We were the first to adopt new technology and define the design pattern for future projects. This undertaking allowed me to understand the value of continuous validation with customers and collaborating with the team to test new technology through a design sprint. My experience in managing various projects with different stakeholders proved immensely helpful in comprehending user behaviors and sparking new ideas. I would like to express my heartfelt gratitude to all participants, users, and the development team who worked with me on this project, providing valuable insights.